 |
ADVANCED IMAGING CENTER PHYSICIAN NEWS |
May 1, 2002 |
VALUE OF IN-PHASE & OUT-OF-PHASE MR IMAGING
in Diagnosing ADRENAL ADENOMAS, FOCAL FATTY INFILTARATION, etc.
|
ADVANCED IMAGING CENTER PHYSICIAN NEWS |
May 1, 2002 |
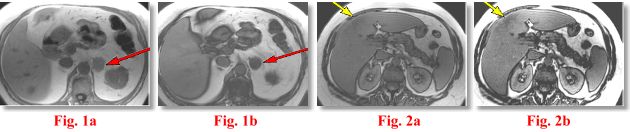
CASE #1: The patient in Fig. 1a-b presented with a left adrenal mass on a CT scan. The question was whether or not this represented a benign adenoma or other solid adrenal tumors including a malignancy.
CASE #2: The patient in Fig. 2a-b presented with a possible right lobe liver mass on a CT. The question was whether or not this represented a benign focal fatty infiltration (FFI) or a solid hepatic tumor including a malignancy.
IMAGING FINDINGS:
PATIENT #1: CT images (not shown) demonstrated a low density left adrenal mass on patient #1 with some enhancement. The CT density on precontrast images was around 0 HU (near water density), which is typically seen with adenomas. The MR image (Fig. 1a) shows the mass to be of intermediate signal intensity on in-phase T1W images (red arrow), which is nonspecific. However, on out-of-phase images (Fig. 1b), the mass became darker, indicating the presence of fatty metamorphism typically seen with a non-functioning adenoma. Diagnosis of an adenoma can be comfortably made with this technique.
PATIENT #2: CT images (not shown) demonstrated an ill-defined low density are in the right lobe of the liver. A mass could not be excluded. The MR image (Fig. 2a) shows the area to be barely visible and of subtle low-to-intermediate signal intensity on in-phase T1W images (yellow arrow), which is nonspecific. However, on out-of-phase images (Fig. 2b), the area became darker, indicating the presence of fatty component typically seen with focal fatty infiltration (FFI).
DISCUSSION: Out-of-phase MR imaging relies on the fact that the protons in water and fat resonate at a slightly different frequency (220 Hz at 1.5 Tesla to be exact). This difference is exploited to cause the fat and water protons to be exactly “out-of-phase”, thus canceling each other out and causing a darker image. This is accomplished by varying the so-called echo-time (TE). At 1.5 Tesla, fat and water protons are “in-phase” at TE’s of about 0, 4.4, 8.8 msec, etc. and “out-of-phase” at TE’s of about 2.2, 6.6 msec, etc *. Out-of-phase MR images typically have a dark border around the organs (“boundary effect”) such as seen in Fig. 1b, 2b. Other fat-containing lesions can be diagnosed in the same manner. All the above MR images were obtained on AIC’s high-field Siemens Symphony utilizing ultrafast breath-hold scanning.
For more information, you may call me at personally (661) 949-8111.
Ray Hashemi, MD, PhD
Director